
Research
What UK households actually spend at salons (2026)
UK household spending at hairdressing and grooming salons, from ONS data released 30 September 2026: £9.29bn in 2025, 17.3% less than 2019 in real terms.
Key figures
- £9.29bn
- UK household spending at hairdressing salons and personal grooming establishments, 2025, current prices (ONS)
- 17.3% lower
- Volume of that spending in 2025 against 2019, price rises taken out (derived from ONS)
- 31.2%
- Rise in salon prices, 2019 to 2025 (ONS implied deflator, derived)
- about £320 a year
- Spending per UK household, 2025 (derived from two ONS releases)
- Seven
- Quarters in a row the volume fell, 2024 Q3 to 2026 Q1 (ONS)
If you write about the UK salon trade for an insurer, a lender, a supplier or the trade press, this is the size of the pot every salon competes for: what households actually spend at hairdressers and personal grooming businesses, from the government’s own figures. Every number below was read off the Office for National Statistics on 25 October 2026, and every one that we worked out ourselves says so and shows the sum.
The short version
- UK households spent £9,289 million at hairdressing salons and personal grooming establishments in 2025, per ONS series CCRE, released 30 September 2026. That is measured by ONS, in current prices.
- Take the price rises out and they bought 17.3% less than in 2019. Derived: ONS’s volume series, CCVZ, was £10,817 million in 2019 and £8,948 million in 2025, both at 2024 prices. See paying more, buying less.
- Prices did the opposite. ONS’s price measure for the same category, AWOQ, rose from 79.1 to 103.8 over the same years, which is 31.2% (derived).
- 2025 was down on 2024 in both cash and volume, and the volume fell for seven quarters in a row before a small rise in April to June 2026. See quarter by quarter.
- About £320 a year per UK household, or about £6 a week. Derived, and rough. See per household.
Year by year
ONS publishes three versions of this one line of household spending. Cash is what households paid at the time. Volume is the same spending with price changes taken out, valued at 2024 prices. The price index is the first divided by the second. All three are from ONS’s Consumer trends release of 30 September 2026, read on 25 October 2026.
| Year | Cash spent, £m (CCRE) | Volume, £m at 2024 prices (CCVZ) | Price index, 2024 = 100 (AWOQ) |
|---|---|---|---|
| 2015 | 7,055 | 9,709 | 72.7 |
| 2016 | 7,536 | 10,164 | 74.1 |
| 2017 | 7,966 | 10,530 | 75.7 |
| 2018 | 8,320 | 10,763 | 77.3 |
| 2019 | 8,558 | 10,817 | 79.1 |
| 2020 | 4,939 | 5,999 | 82.3 |
| 2021 | 5,783 | 6,669 | 86.7 |
| 2022 | 7,743 | 8,504 | 91.1 |
| 2023 | 8,304 | 8,647 | 96.0 |
| 2024 | 9,576 | 9,576 | 100.0 |
| 2025 | 9,289 | 8,948 | 103.8 |
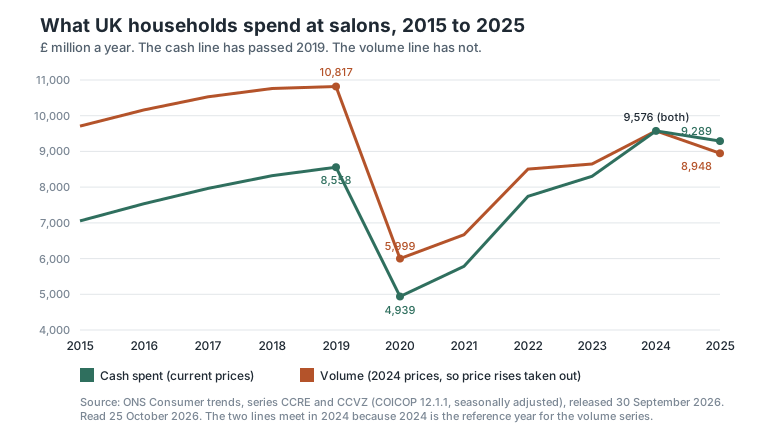
The two columns meet in 2024 because 2024 is the reference year for the volume series. The Consumer trends bulletin for April to June 2026 states that the reference year and last base year for all its volume figures is 2024.
Paying more, buying less
Put 2019 and 2025 side by side and the cash and the volume go in opposite directions.
- Cash spent: up 8.5%, from £8,558 million to £9,289 million. Derived from CCRE.
- Volume bought: down 17.3%, from £10,817 million to £8,948 million at 2024 prices. That is £1,869 million a year less, at 2024 prices. Derived from CCVZ.
- Salon prices: up 31.2% on ONS’s implied price measure, AWOQ, from 79.1 to 103.8. Derived.
A second, separate price measure agrees. The consumer prices index for hairdressing and personal grooming establishments, ONS series D7EY, averaged 109.0 in 2019 and 144.0 in 2025 (2015 = 100), a rise of 32.1%. Prices across the whole basket, ONS series D7BT, rose from 107.8 to 138.4 over the same years, which is 28.4%. Both read 25 October 2026 from the release of 21 October 2026, and both percentages are ours. So salon prices rose a little faster than prices in general.
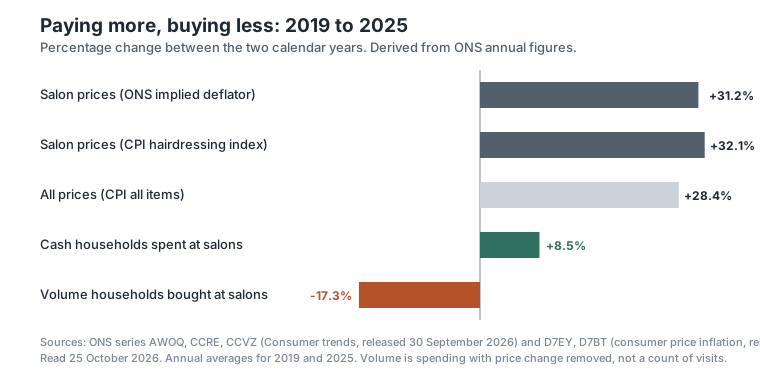
What “volume” means matters here, because it is easy to misread. It is spending with price change removed. It is not a count of appointments. A fall in volume can be fewer visits, longer gaps between visits, cheaper services, or a mix of all three. This series cannot tell those apart, and nor can we.
Quarter by quarter
The quarterly figures show where the last year went. Both columns are seasonally adjusted and come from the same release of 30 September 2026.
| Quarter | Cash spent, £m (CCRE) | Volume, £m at 2024 prices (CCVZ) |
|---|---|---|
| 2024 Q1 (Jan to Mar) | 2,317 | 2,353 |
| 2024 Q2 (Apr to Jun) | 2,420 | 2,417 |
| 2024 Q3 (Jul to Sep) | 2,424 | 2,411 |
| 2024 Q4 (Oct to Dec) | 2,415 | 2,395 |
| 2025 Q1 | 2,374 | 2,327 |
| 2025 Q2 | 2,357 | 2,269 |
| 2025 Q3 | 2,310 | 2,212 |
| 2025 Q4 | 2,248 | 2,140 |
| 2026 Q1 | 2,263 | 2,132 |
| 2026 Q2 | 2,324 | 2,154 |
- The volume fell in every quarter from 2024 Q3 to 2026 Q1, seven in a row, then rose slightly in 2026 Q2. Read off the quarterly values of ONS series CCVZ, released 30 September 2026.
- 2026 Q2 volume was 5.1% below 2025 Q2 (2,154 against 2,269) and 10.9% below 2024 Q2 (2,154 against 2,417), the highest quarter in the table. Derived.
- Cash in 2026 Q2 was 1.4% below 2025 Q2 (2,324 against 2,357). Derived.
- For the full year, 2025 was down on 2024 by 3.0% in cash (9,289 against 9,576) and 6.6% in volume (8,948 against 9,576). Derived.
Per household
About £320 a year per UK household in 2025, or about £6.16 a week. Derived: £9,289 million from CCRE, divided by the 29.0 million UK households in 2025 in ONS’s Families and households in the UK: 2025, released 17 April 2026. £9,289m ÷ 29.0m = £320.31, and £320.31 ÷ 52 = £6.16.
Use it as a sense of scale, not as a household budget. It is an average over every household, including the ones that never set foot in a salon. The two inputs come from different ONS releases built from different sources. And the ONS user guide to Consumer trends separates a national estimate, which includes net tourism, from domestic spending, which does not. We did not find a statement of which one this detailed line follows, so some of the £9,289 million may be spent in UK salons by visitors from abroad.
One more measured figure for scale: in the 2026 consumer prices basket, hairdressing salons and personal grooming establishments carry a weight of 7.683 parts per 1,000, per ONS series CJYN, read 25 October 2026. That is a little under 1% of the basket.
What this series covers, and what it does not
- It is wider than hair. The ONS heading is “Hairdressing salons and personal grooming establishments”, so it includes more than hairdressers. Consumer trends has no finer line that splits hair from beauty or barbering.
- It measures household spending, not salon takings. It says nothing about what any one salon earns, or how the money is shared between salons.
- ONS asks for care at this level of detail. The April to June 2026 bulletin says data below the main headings “should be used with caution and may be subject to larger-than-normal revisions”.
- The numbers move between releases. The version of the cash series released on 30 June 2026 put 2025 at £10,263 million. The release of 30 September 2026, which the bulletin says is consistent with Blue Book 2026, puts it at £9,289 million: £974 million, or 9.5%, lower. Every superseded version is kept on the previous versions page for CCRE. If you quote a figure from this page, quote the release date with it.
- The next release is due 22 December 2026, per the CCRE series page. This page will be updated from it.
The other big numbers you will see for the size of the UK hair and beauty trade measure different things again, such as turnover, value added or a wider industry. We set those side by side in why UK hair and beauty industry figures disagree.
Method
Every input is an ONS figure read on 25 October 2026 from the series page or its data download. Nothing was estimated, and nothing was rounded before the arithmetic. Each derived figure is below with its sum.
- Volume change, 2019 to 2025: 8,948 ÷ 10,817 = 0.8272, so 17.3% lower. The gap is 10,817 − 8,948 = £1,869 million at 2024 prices. Inputs: annual values of ONS series CCVZ, released 30 September 2026.
- Cash change, 2019 to 2025: 9,289 ÷ 8,558 = 1.0854, so 8.5% higher. Inputs: CCRE annual values.
- Price change, 2019 to 2025: 103.8 ÷ 79.1 = 1.3123, so 31.2% higher. Input: AWOQ annual values. As a check, AWOQ equals cash divided by volume: 9,289 ÷ 8,948 × 100 = 103.8 for 2025, and 8,558 ÷ 10,817 × 100 = 79.1 for 2019. AWOQ is not seasonally adjusted while CCRE and CCVZ are, which makes no difference to calendar-year totals here: the check matches in every year from 2015 to 2025.
- CPI comparison, 2019 to 2025: hairdressing 144.0 ÷ 109.0 = 1.3211, so 32.1%; all items 138.4 ÷ 107.8 = 1.2839, so 28.4%. Inputs: D7EY and D7BT annual averages.
- 2024 to 2025: cash 9,289 ÷ 9,576 = 0.9700, so 3.0% lower; volume 8,948 ÷ 9,576 = 0.9344, so 6.6% lower.
- Quarters: 2,154 ÷ 2,269 = 0.9493, so 5.1% lower; 2,154 ÷ 2,417 = 0.8912, so 10.9% lower; cash 2,324 ÷ 2,357 = 0.9860, so 1.4% lower. Inputs: CCVZ and CCRE quarterly values.
- Per household: £9,289 million ÷ 29.0 million households = £320.31 a year; ÷ 52 = £6.16 a week. Inputs: CCRE 2025 and ONS Families and households in the UK: 2025.
- Revision: 10,263 − 9,289 = 974, and 974 ÷ 10,263 = 9.5%. The £10,263 million is the 2025 value in the CCRE data as released on 30 June 2026, read from ONS’s own data service on 25 October 2026.
Our own account data will not replace these figures, because they measure the whole country and we see a handful of salons. They will be re-derived from each new ONS release, starting with the one due on 22 December 2026.
This page is one of a set. The figures that sit around it, from what a new client costs to how clients find a salon, are collected in UK Salon Marketing Statistics.
Sources
- 1. ONS, Consumer trends series CCRE: 12.1.1 Hairdressing salons and personal grooming establishments, current prices, seasonally adjusted, £m Read 2026-09-30
- 2. ONS, Consumer trends series CCVZ: 12.1.1 Hairdressing salons and personal grooming establishments, chained volume measure, seasonally adjusted, £m Read 2026-09-30
- 3. ONS, Consumer trends series AWOQ: 12.1.1 Hairdressing salons and personal grooming establishments, implied deflator, 2024=100 Read 2026-09-30
- 4. ONS, Consumer trends, UK: April to June 2026 (bulletin) Read 2026-09-30
- 5. ONS, CPI index 12.1.1: Hairdressing and personal grooming establishments, 2015=100 (D7EY) Read 2026-10-21
- 6. ONS, CPI index 00: All items, 2015=100 (D7BT) Read 2026-10-21
- 7. ONS, CPI weights 12.1.1: Hairdressing salons and personal grooming establishments (CJYN) Read 2026-10-21
- 8. ONS, Families and households in the UK: 2025 Read 2026-04-17
- 9. ONS, previous versions of series CCRE Read 2026-09-30
Cite this page
Free to quote with a link back. Figures were last checked on 25 October 2026.
Salon Ads Studio, "What UK households actually spend at salons (2026)", 2026. https://salonadsstudio.com/research/what-uk-households-actually-spend-at-salons-2026/
A plain-text version for AI tools and reference managers: /research/what-uk-households-actually-spend-at-salons-2026.md
