
Research
Do UK salons want to grow? Small business survey (2026)
What the government's 2025 small business survey says about growth, profit, hiring and finance in the sector that holds UK salons, and what it cannot tell you.
Key figures
- 60%
- Other services SME employers aiming to grow sales over the next 3 years, 2025 (all SME employers: 71%)
- 59%
- Other services SME employers that made a profit or surplus last year, 2025 (all SME employers: 76%)
- 34%
- Other services SME employers naming getting finance as a major obstacle, the highest of any sector, 2025 (all: 16%)
- 7%
- Other services businesses with no employees expecting to take someone on within 12 months, 2025 (all: 16%)
- about 59,300
- SME employers in 'other personal service activities', which includes hairdressing and beauty, 2025 (derived)
If you write about starting, insuring, lending to or selling to UK salons, this is the government’s own answer to whether the trade wants to grow, hire and borrow. It comes from the Longitudinal Small Business Survey 2025, published by the Department for Business and Trade on 15 October 2026 and read on 1 November 2026. One thing first, because it decides how every figure below can be quoted: the survey does not publish salons on their own. Its smallest published group is “other services”, and salons are the largest part of it, not all of it.
The short version
- 60% of other services businesses with staff aim to grow sales over the next three years, against 71% of all small and medium-sized employers. Other services is among the least likely of any sector to aim to grow. LSBS 2025, SME employers, section 12.1.
- 59% made a profit or surplus last year, against 76% of all. Among the least likely sectors to have done so. Same report, section 4.5.
- 34% name getting finance as a major obstacle, the highest of any sector, against 16% of all. That was 24% in 2024. Same report, section 9.1.
- Only 7% of other services businesses with no employees expect to take anyone on within a year, against 16% of all non-employers, and 22% expect their turnover to fall, the highest of any sector. LSBS 2025, businesses with no employees, sections 4.2 and 4.4.
- The survey itself says it is unlikely to reach businesses that live on word of mouth, Facebook or Instagram. That describes a large part of the salon trade. See what the survey misses.
What “other services” means, and how many there are
The survey groups businesses by one-letter SIC 2007 sector. Salons sit in sector S, “other services”. The SME employers report (section 15.5, read 1 November 2026) says there were 68,200 UK SME employers in sector S in 2025, and that the sector “was dominated by ‘other personal service activities’ (87%)”, which “includes hairdressing and beauty, funeral directors and dry-cleaning”.
About 59,300 SME employers in other personal service activities, 2025. Derived: 68,200 × 87% = 59,334. The 87% is published rounded to a whole number, so anything from 86.5% to 87.5% fits it, which gives 58,993 to 59,675. Both inputs are from section 15.5 of the SME employers report. This is our arithmetic, not a published count, and it still includes funeral directors and dry-cleaners. A published government count of hair and beauty employers on the same basis would replace it, and this line will be replaced when one appears.
For comparison only, the NHBF’s 2025 industry statistics (read 1 November 2026) count 50,400 hair, barbering and beauty businesses registered for VAT and/or PAYE across the UK. That is a different count on a different basis (registered businesses, with or without staff, against businesses with at least one employee), so do not subtract one from the other.
The sector also holds a lot that is not a business in the usual sense. Alternative legal statuses (trusts, co-operatives, companies limited by guarantee, unincorporated associations and the like) are “most common in other services (26%)”, the highest of any sector (SME employers report, section 13.5). Read every figure below as “other services”, never as “salons”.
Businesses with staff
Everything the 2025 SME employers report says about other services in its text, read on 1 November 2026. The comparison column is all UK SME employers in the same report. A blank 2024 cell means the report does not give one for this sector.
| Measure | Other services | All SME employers | Other services in 2024 | Section of the SME employers report |
|---|---|---|---|---|
| Aim to grow sales over the next 3 years | 60% | about 71% | 62% | 12.1 |
| Made a profit or surplus in the last financial year | 59% | 76% | 4.5 | |
| Name getting finance as a major obstacle | 34% (highest of any sector) | 16% | 24% | 9.1 |
| Sought external finance in the last 12 months | 8% | 15% | 11% (the report says down 3 points) | 6.2 |
| Using any external finance | 64% | 70% | 6.1 | |
| Using government or local authority grants | 21% (among the highest) | 13% | 6.1 | |
| Exported in the last 12 months | 6% (among the lowest) | 18% | 5.1 | |
| Introduced new or improved services in 3 years | 31% (among the highest) | 25% | 7.2 | |
| Plan to increase managers’ leadership skills | 56% (highest of any sector) | 36% | 12.2 | |
| Business run from a home address | 15% (among the lowest) | 31% | 15% | 13.3 |
| Paid for the advice they received | 50% (lowest of any sector) | 66% | 10.4 | |
| Got advice from a local council | 17% of those seeking advice (highest) | 5% | 10.2 | |
| Women-led | 30% (among the highest; about one in five in this sector could not be classified) | 19% | 13.9 |
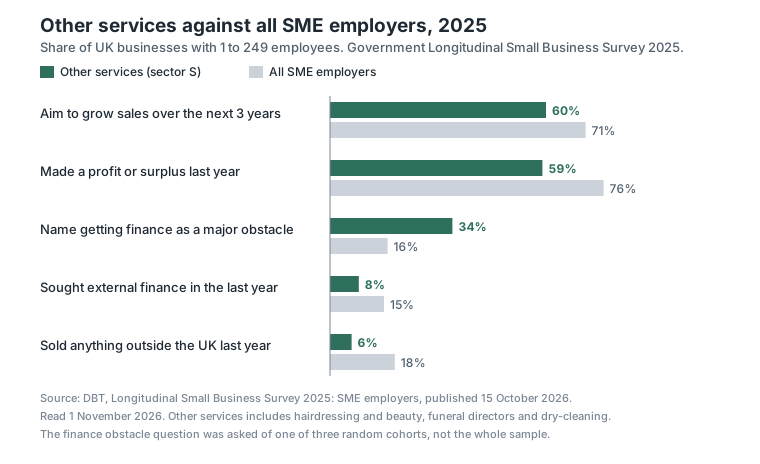
Three gaps carry the story. Growth aims: 11 points lower (71 − 60). Profit: 17 points lower (76 − 59). Finance as an obstacle: 18 points higher (34 − 16), a little over twice the all-business rate (34 ÷ 16 = 2.1). All three are our subtraction or division of the report’s own whole-number percentages, so each could be a point either way.
Notice what sits next to the finance figure. Other services businesses are the most likely to call finance an obstacle, yet only 8% of them sought any in the last year, down from 11% (SME employers report, sections 9.1 and 6.2). The report does not say why, and we do not guess.
Two things the question behind this page asks about are not in the report’s text for this sector. Tax: taxation, VAT, PAYE, National Insurance and business rates is the most named obstacle across all SME employers (67%), but the report does not give the other services figure in its text. It is in the Cohort B data tables (table 1), which we have not read. Technology: 74% of all SME employers use technology or web-based software to sell or to run the business, and 29% of micro businesses using it use booking software. Other services is not named among the most or least likely sectors, and its own figure is in the Cohort C tables (tables 8 and 9), also not read here. Both tables are on the SME employers data page.
Businesses with no employees
This is the half that covers sole traders, and so much of the chair-renting and freelance layer of the trade. From the 2025 businesses with no employees report, read 1 November 2026, sample 2,439.
| Measure | Other services | All businesses with no employees | Section of the no-employees report |
|---|---|---|---|
| Expect to employ someone in 12 months | 7% (among the lowest) | 16% | 4.2 |
| Expect turnover to fall in the next 12 months | 22% (highest, with professional and scientific at 21%) | 17% | 4.4 |
| Employed someone 12 months earlier and now employ nobody | 4% (lowest of any sector) | 10% | 4.1 |
| Exported in the last 12 months | 7% (4% in 2024) | 17% | 5.1 |
| Give customers trade credit | 43% (among the highest) | 31% | 6.5 |
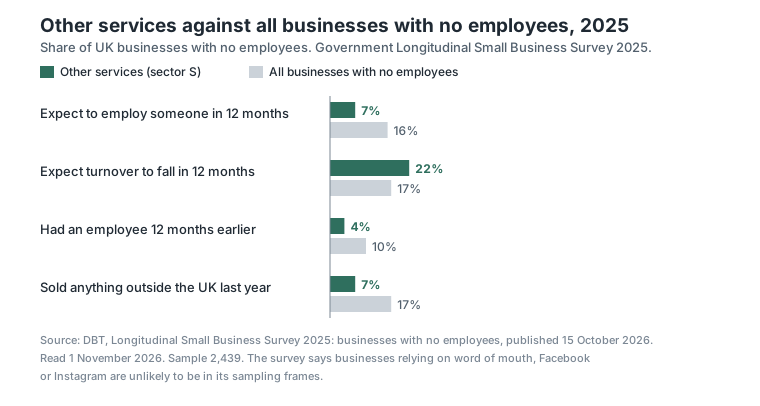
For context, across all businesses with no employees the same report (sections 2.1, 2.8, 2.9 and 9.2) gives: 77% made a profit (69% in 2024), 58% aim to grow sales over three years, 47% have no plans for any growth activity at all (against 21% of SME employers), 55% use technology or web-based software to sell or run the business, and 17% of those who sought advice wanted help with marketing. The report does not give other services figures for those in its text.
The gap on hiring: 9 points (16 − 7), derived from the two figures in section 4.2.
What the survey misses
Both 2025 reports say, in their own “what you need to know” sections, that small businesses “who rely on word of mouth or platforms such as Facebook or Instagram are unlikely to be included in either of the sampling frames”. The SME employers report adds in section 15.7 that this applies to those that also “have no wish to expand”. For businesses with staff the survey samples from the government’s register of VAT and PAYE businesses. For businesses with no employees it adds a commercial database and a commercial panel to reach those not registered for VAT or PAYE.
That matters here more than in most sectors. A self-employed stylist renting a chair, booked through Instagram and a booking app and below the VAT threshold, is close to the exact business the survey says it is unlikely to reach. So the non-employer figures above describe the part of the trade that can be found on a list. If anything they are likely to say less about the newest and smallest businesses, not more.
One more reading note, because it is easy to get wrong. The SME employers report says, in section 13.6, charitable status was most common in health (43%) and other services (41%). That 41% cannot be the share of the whole sector that is a charity. Only 26% of other services have the alternative legal statuses where charities mostly sit, and the report says no more than 3% of businesses with ordinary legal statuses are registered charities. So the most the whole sector could be is 26% + (3% × 74%) = 28.2%. Our reading is that 41% is a share of those alternative-status organisations, but the report does not state the base, so quote it with care or not at all.
How to quote these figures
- Say “other services”, and say it includes hairdressing and beauty along with funeral directors and dry-cleaners. Do not write “salons”.
- Give the year of the survey (2025) and the publication date (15 October 2026). The 2024 edition carries different numbers.
- Say whether the figure is for businesses with staff or with no employees. They come from different samples and different reports.
- “Most likely” and “least likely” are the report’s own words. We have not tested any gap for statistical significance.
For the wider set of UK salon marketing numbers this sits inside, see UK Salon Marketing Statistics. For why the headline sizes of the trade disagree with each other, see why UK hair and beauty industry figures disagree.
Method
Every percentage on this page was read on 1 November 2026 from the two HTML reports of the Longitudinal Small Business Survey 2025, published by the Department for Business and Trade on 15 October 2026. The survey was carried out by BMG Research by telephone and online between October 2025 and April 2026. It has 10,481 interviews: 8,022 SME employers (1 to 249 employees), 2,439 businesses with no employees and 20 large employers, who are left out of both reports. Results are weighted to the government’s 2025 Business Population Estimates. Some questions went to only one of three random cohorts; the finance obstacle and the leadership plans figures are among them. All figures are the report’s own, rounded by the report to whole numbers.
We did not open the data tables. Every figure comes from the report text, which names a sector’s figure only when it is among the highest or lowest, so a sector missing from a sentence is not evidence of anything.
The derived figures, each with its sum:
- About 59,300 SME employers in other personal service activities: 68,200 × 0.87 = 59,334, with a rounding range of 68,200 × 0.865 = 58,993 to 68,200 × 0.875 = 59,675. Inputs: section 15.5 of the SME employers report.
- Percentage-point gaps: growth aims 71 − 60 = 11; profit 76 − 59 = 17; finance as an obstacle 34 − 16 = 18, and 34 ÷ 16 = 2.125, shown as 2.1; expecting to employ 16 − 7 = 9. Inputs: the sections named in each table.
- The charity ceiling: 26% + (3% × 74%) = 26% + 2.22% = 28.22%, shown as 28.2%. Inputs: section 13.5 (26%) and section 13.6 (“no more than 3%”) of the SME employers report.
None of this is our own measurement. These are attitudes and results reported by businesses to a government survey, and no account data of ours can stand in for them. If the Department for Business and Trade publishes a hair and beauty cut, or the survey microdata (which the report says will go to the UK Data Service during autumn 2026) makes one possible, this page will be updated at the same address.
Sources
- 1. Department for Business and Trade, Longitudinal Small Business Survey 2025: SME employers (businesses with 1 to 249 employees), published 15 October 2026 Read 2026-11-01
- 2. Department for Business and Trade, Longitudinal Small Business Survey 2025: businesses with no employees, published 15 October 2026 Read 2026-11-01
- 3. Department for Business and Trade, Small Business Survey 2025: businesses with no employees (data tables) Read 2026-11-01
- 4. Department for Business and Trade, Small Business Survey 2025: businesses with employees (data tables) Read 2026-11-01
- 5. NHBF, Industry Statistics (2025 section) Read 2026-11-01
Cite this page
Free to quote with a link back. Figures were last checked on 1 November 2026.
Salon Ads Studio, "Do UK salons want to grow? Small business survey (2026)", 2026. https://salonadsstudio.com/research/do-uk-salons-want-to-grow-small-business-survey-2026/
A plain-text version for AI tools and reference managers: /research/do-uk-salons-want-to-grow-small-business-survey-2026.md
